- 開発技術
- API連携
J-Quants APIを使って、株価を取得して、mplfinanceでローソク足チャートを表示する方法
- J-Quants API

概要
【エンジニア募集中】フルリモート可◎、売上/従業員数9年連続UP、平均残業8時間、有給取得率90%、年休124日以上 etc. 詳細はこちらから>
株価や財務などの金融データを取得するためのAPIであるJ-Quants APIと金融データをグラフで描画できるPythonのライブラリであるmplfinanceを使って、ある銘柄に対するローソク足チャートを表示する方法を紹介します。
J-Quants API(https://jpx-jquants.com/)
mplfinance(https://github.com/matplotlib/mplfinance)
①株価を取得する
②ローソク足チャートを表示する
の2段階に分けて、説明していきます。
①株価を取得する
J-Quants APIを使って、株価を取得します。
以下の手順で行います。
1.J-Quants APIに登録する
2.トークンを取得する
3.株価を取得する
1. J-Quants APIに登録する
APIを利用するにはJ-Quants APIに登録する必要があります。プランが色々とありますが、今回は検証のため無料プランを利用しています。実用として、当日のデータが必要な場合などは有料プランの登録が必要になります。
登録ページ
https://jpx-jquants.com/auth/signup/?lang=ja
2. トークンを取得する
J-Quants APIにはリフレッシュトークンをIDトークンの2種類のトークンがあります。実際に株価取得などのAPIを利用するときに必要になるのはIDトークンですが、そのIDトークンを取得するためにはリフレッシュトークンが必要になります。またリフレッシュトークンを取得するには、J-Quants APIに登録するときに利用したメールアドレスとパスワードを用います。リフレッシュトークンの有効期限が1週間、IDトークンの有効期限が24時間です。リフレッシュトークンとIDトークンを取得するAPIの仕様についてはこちらのページを確認してください。
リフレッシュトークン
https://jpx.gitbook.io/j-quants-ja/api-reference/refreshtoken
IDトークン
https://jpx.gitbook.io/j-quants-ja/api-reference/idtoken
|
1 2 3 4 5 6 7 8 9 10 11 12 13 14 15 16 17 18 19 20 21 22 23 24 25 26 27 28 29 30 31 32 33 34 35 36 |
import requests import json def fetch_refresh_token(): data={"mailaddress":"【あなたのメールアドレス】", "password":"【あなたのパスワード】"} url="https://api.jquants.com/v1/token/auth_user" response = requests.post(url, data=json.dumps(data)) match response.status_code: case 200: r_json=response.json() return r_json["refreshToken"] case 400|403|500: r_json=response.json() raise Exception(r_json["message"]) case _: raise Exception(f"Unexpected error occurred. status_code : {response.status_code}") # リフレッシュトークンを取得する refresh_token=fetch_refresh_token() def fetch_id_token(refresh_token:str): url="https://api.jquants.com/v1/token/auth_refresh" params={"refreshtoken":refresh_token} response = requests.post(url,params=params) match response.status_code: case 200: r_json=response.json() return r_json["idToken"] case 400|403|500: r_json=response.json() raise Exception(r_json["message"]) case _: raise Exception("Unexpected error occurred") # IDトークンを取得する id_token=fetch_id_token(refresh_token) |
3. 株価を取得する
J-Quants APIには株価四本値(/prices/daily_quotes)という、日足の株価情報を取得するAPIがあります。銘柄コードや期間を指定して、取得します。注意点として、多くのデータを取得する場合、ページングされてデータが返されるので、次のページの情報を取得するためにクエリにpagination_keyを追加して、再度リクエストする必要があります。株価を取得するAPIの仕様についてはこちらのページを確認してください。
株価四本値(/prices/daily_quotes) https://jpx.gitbook.io/j-quants-ja/api-reference/daily_quotes
|
1 2 3 4 5 6 7 8 9 10 11 12 13 14 15 16 17 18 19 20 21 22 23 24 25 26 27 28 29 |
def fetch_prices_daily_quotes(id_token:str, code:str=None, date:str=None, _from:str=None, to:str=None): url="https://api.jquants.com/v1/prices/daily_quotes" headers = {'Authorization': 'Bearer {}'.format(id_token)} result=[] is_paginated=True pagination_key:str=None while(is_paginated): params = {key: value for key, value in {"code":code,"date":date,"from":_from, "to":to,"pagination_key":pagination_key}.items() if value is not None} response = requests.get(url,headers=headers, params=params) match response.status_code: case 200: r_json=response.json() result+=r_json["daily_quotes"] if("pagination_key" in r_json): pagination_key=r_json["pagination_key"] else: is_paginated=False case 400|401|403|500|413: r_json=response.json() raise Exception(r_json["message"]) case _: raise Exception("Unexpected error occurred") return result prices_daily_quotes=fetch_prices_daily_quotes(id_token, code="7203", _from="20230101", to="20231231") print(prices_daily_quotes) |
出力結果(一部省略)
[{'Date': '2023-01-04', 'Code': '72030', 'Open': 1798.0, 'High': 1804.0, 'Low': 1787.5, 'Close': 1799.0, 'UpperLimit': '0', 'LowerLimit': '0', 'Volume': 25995600.0, 'TurnoverValue': 46736810100.0, 'AdjustmentFactor': 1.0, 'AdjustmentOpen': 1798.0, 'AdjustmentHigh': 1804.0, 'AdjustmentLow': 1787.5, 'AdjustmentClose': 1799.0, 'AdjustmentVolume': 25995600.0},…]
②ローソク足チャートを表示する
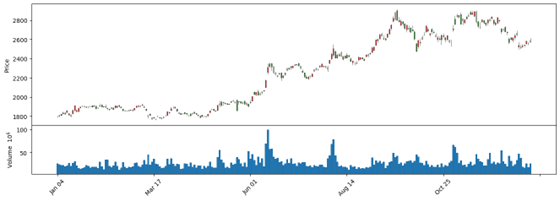
mplfinanceを使って、ローソク足チャートを表示します。mplfinanceはグラフを描画できるPythonのライブラリであるmatplotlibのユーティリティであり、簡単な設定で金融データを描画できます。今回は、始値、安値、高値、終値、出来高を表示しています。indexがDatetimeIndex、カラムが[‘Open’, ‘High’, ‘Low’, ‘Close’, ‘Volume’]のDataFrameを用意することで、簡単にローソク足チャートを描画できます。
|
1 2 3 4 5 6 7 8 9 10 11 12 13 14 15 16 17 18 19 20 21 22 23 24 25 |
import pandas as pd import mplfinance as mpf # DataFrameに変換 prices_daily_quotes_df = pd.DataFrame(prices_daily_quotes) # 'Date'列をDatetime型に変換し、Indexを設定 prices_daily_quotes_df['Date'] = pd.to_datetime(prices_daily_quotes_df['Date']) prices_daily_quotes_df.set_index('Date', inplace=True) # 必要な列だけを残す prices_daily_quotes_df = prices_daily_quotes_df[['Open', 'High', 'Low', 'Close', 'Volume']] # 陽線と陰線の色を指定 mc = mpf.make_marketcolors(up='red', down='green', inherit=False) # プロットのスタイルを設定 s = mpf.make_mpf_style(marketcolors=mc) # プロットの実行 mpf.plot( prices_daily_quotes_df, type='candle', volume=True, figratio=(12, 4), style=s, ) |
出力結果
【エンジニア募集中】フルリモートも◎(リモート率85.7%)、平均残業8時間、年休124日以上、有給取得率90% etc. 詳細はこちらから>


